
NEPSE – July Rally Pattern Analysis
Date: June 29, 2026
Historical July Pattern:
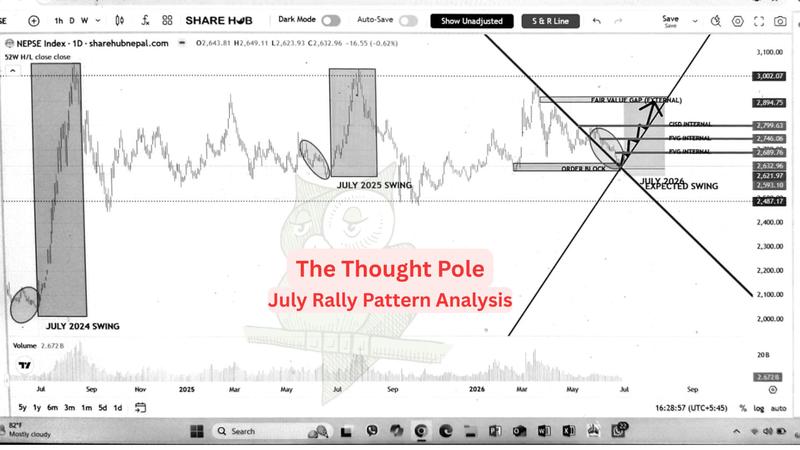
June 2024 — Market was moving sideways consolidating with no clear direction.
July 2024 — Strong high swing appeared, bulls took control from the bottom.
June 2025 — Market showed mild downtrend, slight bearish pressure building.
July 2025 — Again a beautiful high swing rally emerged, history repeated.
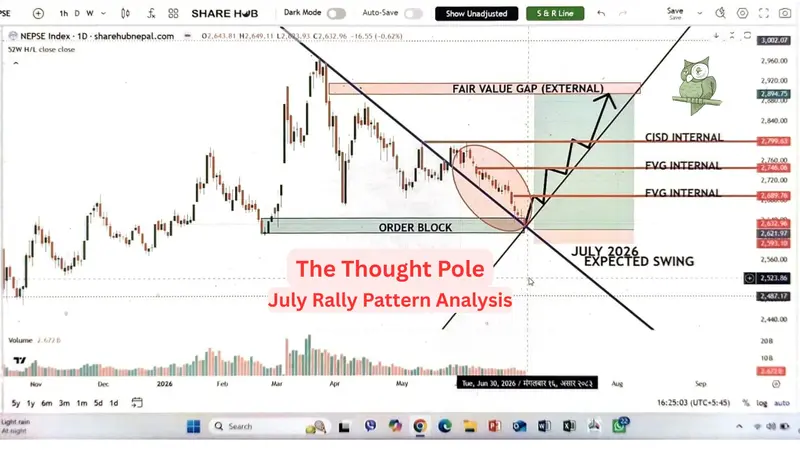
June 2026 — Market is currently in downtrend, sitting at 2,632 on Order Block support.
July 2026 — Pattern suggests another high swing is loading...
Same pattern, three consecutive years — June weakness, July strength.
SMC View (Smart Money Concepts):
Order Block defended → Internal FVGs at 2,689–2,746 → CISD at 2,799 → External FVG targeting 2,894+
⚠️ Disclaimer: Investment/trading in the security market is subject to market risk. Past performance is not a guarantee of future performance. Consult your financial advisor before investing.
NEPSE July Rally Pattern Analysis (June 29, 2026)
The Nepal Stock Exchange (NEPSE) is once again approaching a technically significant point as the market trades near 2,632, a level many technical analysts identify as an important Order Block support. Looking back over the past two years, an interesting seasonal price pattern has emerged: June has consistently been a month of weakness, while July has delivered strong bullish recoveries.
Although history never guarantees future performance, recurring market behavior often attracts the attention of traders seeking high-probability setups.
Looking Back at Recent Market Cycles
June 2024
The market spent most of June moving sideways in a consolidation range. Buyers and sellers remained balanced, with no clear trend developing.
July 2024
Following the prolonged consolidation, buying pressure increased significantly. Bulls regained control and NEPSE recorded a strong upward swing from lower levels.
June 2025
The market entered a mild downtrend as bearish sentiment gradually strengthened. Selling pressure dominated most sessions.
July 2025
The pattern repeated almost perfectly. After June's weakness, the market staged another impressive rally, rewarding investors who accumulated during the correction.
June 2026
NEPSE is once again trading under bearish pressure. The index is currently hovering around 2,632, coinciding with an important support zone identified through Smart Money Concepts (SMC).
Is July 2026 Setting Up the Same Way?
The similarities between the previous market cycles are noteworthy.
- June 2024: Consolidation
- July 2024: Strong bullish rally
- June 2025: Bearish correction
- July 2025: Strong bullish rally
- June 2026: Downtrend into key support
While no market follows an identical path every year, repeated structural behavior often becomes an area of interest for institutional and retail traders alike. If buyers successfully defend current support, July could once again become a month of improving momentum.
Smart Money Concepts (SMC) View
Current market structure highlights several technical levels worth monitoring:
- Order Block Support: 2,632
- Internal Fair Value Gap (FVG): 2,689–2,746
- CISD Confirmation Level: 2,799
- External Fair Value Gap: 2,894+
A sustained move above these levels would strengthen the bullish technical structure, while failure to hold the Order Block may invalidate the current outlook.
What Traders Should Watch
Rather than assuming history will repeat, traders should look for confirmation through price action, volume, and market participation.
Key signals include:
- Strong buying reaction from the Order Block
- Increasing trading volume during upward moves
- Break and close above 2,799
- Continuation toward higher liquidity zones
These confirmations would provide stronger evidence that buyers are regaining control.
Final Thoughts
Historical market patterns can offer valuable context, but they should never be treated as certainty. NEPSE has shown a consistent tendency toward June weakness followed by July strength over the past two years, making the current setup particularly interesting for technical traders.
Whether July 2026 follows the same trajectory will ultimately depend on how price reacts around current support levels and whether buyers can reclaim key resistance zones. Investors should combine historical analysis with sound risk management and independent research before making investment decisions.
Disclaimer: Investment and trading in the securities market are subject to market risks. Historical price patterns and past performance do not guarantee future results. This article is intended solely for educational and informational purposes and should not be considered financial or investment advice. Always conduct your own research and consult a licensed financial advisor before making investment decisions.