In the stock market, price movements often tell a story long before headlines do. For investors following Nepal's hydropower sector, Sanvi Energy Ltd. (SANVI) is currently presenting one of the more interesting technical setups on the board.
After months of correction and sideways movement, the stock is showing several signs that suggest momentum may be shifting back in favor of buyers.
While no technical analysis guarantees future performance, SANVI's chart structure deserves attention from traders and long-term investors alike.
From Strong Rally to Healthy Correction
Earlier in the year, SANVI experienced a powerful upward move that attracted significant market interest. Like most stocks after a sharp rise, profit booking eventually followed, pushing prices lower.
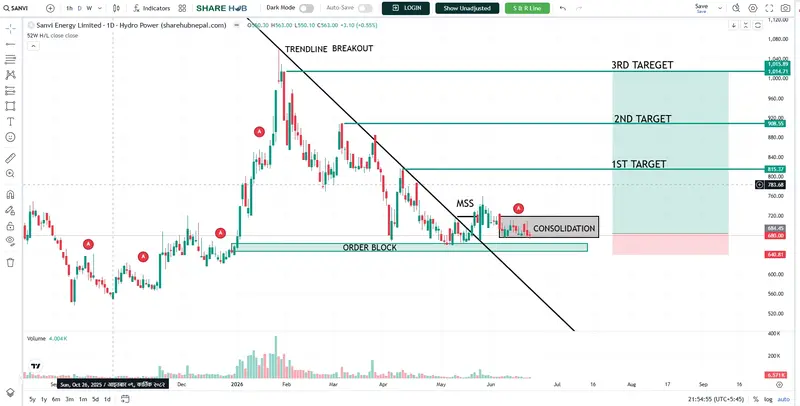
The correction created a clear pattern of lower highs and lower lows, forming a descending trendline that acted as resistance for several months.
At first glance, this looked like a stock losing momentum.
However, experienced traders often understand that corrections are not necessarily bearish. In many cases, they serve as a period of consolidation where stronger hands gradually accumulate positions while weaker participants exit the market.
That appears to be what may have happened with SANVI.
The Importance of the Order Block
One of the most notable features on the chart is the demand zone between 650 and 670, often referred to in Smart Money Concept (SMC) analysis as a Bullish Order Block.
This area represents the final bearish movement before the stock's previous strong rally.
Why is that important?
Because institutional investors often build positions in these zones. When price returns to the same region and finds support again, it can indicate that larger market participants remain interested in the stock.
SANVI has tested this area multiple times and continued to hold above it.
That repeated defense strengthens the significance of the zone.
A Shift in Market Structure
Markets move in trends, and trends change when market structure changes.One of the strongest bullish signals in technical analysis is a Market Structure Shift (MSS).
After spending months creating lower highs and lower lows, SANVI began breaking above key swing highs and started forming higher lows.
In simple terms, sellers are no longer controlling the market as they once did.
Buyers are gradually taking charge.
This shift often acts as an early signal that a larger trend reversal could be developing.
The Trendline Breakout That Matters
Perhaps the most encouraging development is the breakout above the descending trendline.
Trendlines are not magical indicators, but they provide a visual representation of market sentiment.
For months, every rally in SANVI was capped by this falling resistance line.
Now that price has moved above it, the market is sending a different message.
The breakout becomes even more meaningful because it occurred near a major demand zone. When multiple technical factors align, traders often pay closer attention.
This combination of institutional support and structural breakout strengthens the bullish case.
Why Consolidation Is Not a Bad Sign
Since the breakout, SANVI has been trading within a relatively tight range around the 680–720 zone.
Some investors mistake consolidation for weakness.
In reality, healthy consolidations often act as launching pads for future moves.
Instead of seeing aggressive selling, the stock is holding its gains and moving sideways. This behavior suggests that supply is being absorbed rather than overwhelming demand.
From a Smart Money perspective, this can indicate re-accumulation before the next expansion phase.
Levels to Watch
As long as SANVI remains above the 650 demand zone, the bullish structure remains valid.
Key upside levels include:
- First Target: 815
- Second Target: 908
- Third Target: 1,015
These levels align with previous resistance zones where traders may consider taking profits.
A breakout above the current consolidation range, supported by strong volume, would significantly strengthen the probability of these targets being tested.
Final Thoughts
SANVI's current chart combines several bullish technical elements that traders often look for:
- Strong institutional demand zone
- Market Structure Shift
- Trendline breakout
- Healthy consolidation
Together, these signals suggest that the stock may be transitioning from correction to accumulation.
Of course, markets are never certain, and risk management remains essential. However, based on current price action, SANVI appears to be building a foundation that could support a larger move in the weeks ahead.
For investors searching for technically strong setups in Nepal's hydropower sector, SANVI is undoubtedly a stock worth keeping on the watchlist.